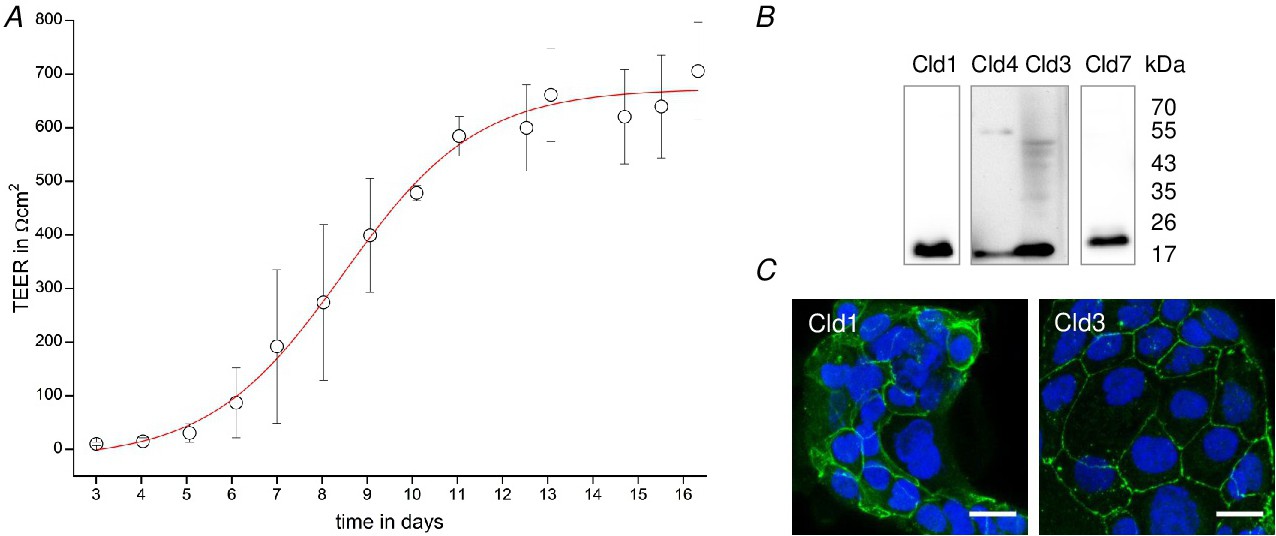
Fig. 1. Calu-3 cells cultivated in transwell inserts formed a tight barrier. (A) Time course of TEER development recorded with the cellZscope for cells cultivated in transwell inserts. The data points represent the average ± SEM from three independent experiments. The red line represents a fitting of the data points to the Boltzmann equation. (B) Expression of the claudin (Cld) isoforms Cld1, Cld3, Cld4, and Cld7 in Calu-3 cells shown by western blotting. (C) Immunofluorescence staining shows intercellular membrane localisation of Cld1 and Cld3. The scale bar represents 20 µm.